Some fun with monitoring
I recently switched my home lab from ProxMox VMs to HashiCorp Nomad, Consul, Vault and containers running on bare metal servers, and I needed a way to monitor this stack, my applications as well as external systems that I care about.
The Monitoring Stack
I looked at a bunch of options and finally settled on Prometheus, Grafana and some other smaller exporters that could scrape the data I needed and present it in a simple way.
Exporters
If you’re not familiar with how Prometheus works, the basic essential you need to know is that Prometheus servers will scrape targets periodically to collect metrics. This is a problem if you need to scrape data from a network device that only supports SNMP, or you need connection metrics for a website where you can’t install more detailed web server metrics exporters. I can’t install a Prometheus exporter on my Juniper firewall for example, well I probably could since it’s a BSD OS underneath but that would most likely mean a lot of pain during software upgrades. However, there are two exporters that can help out here:
- snmp-exporter - Act as a proxy and scrape SNMP data from a device
- blackbox-exporter - Act as a proxy and scrape HTTP (and other) metrics from a url
The configuration
I’m running Prometheus, Alertmanager, snmp-exporter and blackbox-exporter in Nomad with Consul service discovery. My Prometheus config for the blackbox-exporter and snmp-exporter are below:
Blackbox Exporter Config
scrape_configs:
  - job_name: 'blackbox'
    metrics_path: /probe
    params:
      module: [http_2xx]  # Look for a HTTP 200 response.
    static_configs:
      - targets:
        - https://sigterm.sh
        - https://lg.gxa.dn42.io
        - https://mx.gxa.io/ping/
        - https://nyc-1.us.gxa.dn42.io/api/bgp
        - https://sfo-1.us.gxa.dn42.io/api/bgp
        - https://fra-1.de.gxa.dn42.io/api/bgp
    relabel_configs:
      - source_labels: [__address__]
        target_label: __param_target
      - source_labels: [__param_target]
        target_label: instance
      - target_label: __address__
        replacement: blackbox-exporter.service.consul:9115
        # ^ The blackbox exporter's real hostname:port.

  - job_name: 'blackbox-imap'
    metrics_path: /probe
    params:
      module: [imap_starttls]
    static_configs:
      - targets:
        - mx.gxa.io:143
    relabel_configs:
      - source_labels: [__address__]
        target_label: __param_target
      - source_labels: [__param_target]
        target_label: instance
      - target_label: __address__
        replacement: blackbox-exporter.service.consul:9115
        # ^ The blackbox exporter's real hostname:port.

  - job_name: 'blackbox-smtp'
    metrics_path: /probe
    params:
      module: [smtp_starttls]
    static_configs:
      - targets:
        - mx.gxa.io:587
    relabel_configs:
      - source_labels: [__address__]
        target_label: __param_target
      - source_labels: [__param_target]
        target_label: instance
      - target_label: __address__
        replacement: blackbox-exporter.service.consul:9115
        # ^ The blackbox exporter's real hostname:port.
SNMP Exporter Config
scrape_configs:
- job_name: 'snmp'
scrape_interval: 60s
scrape_timeout: 55s
static_configs:
- targets:
- 172.29.255.6
- 172.29.255.7
- 172.29.60.254
- 172.29.58.1
metrics_path: /snmp
params:
module: [if_mib]
relabel_configs:
- source_labels: [__address__]
target_label: __param_target
- source_labels: [__param_target]
target_label: instance
- target_label: __address__
replacement: snmp-exporter.service.consul:9116
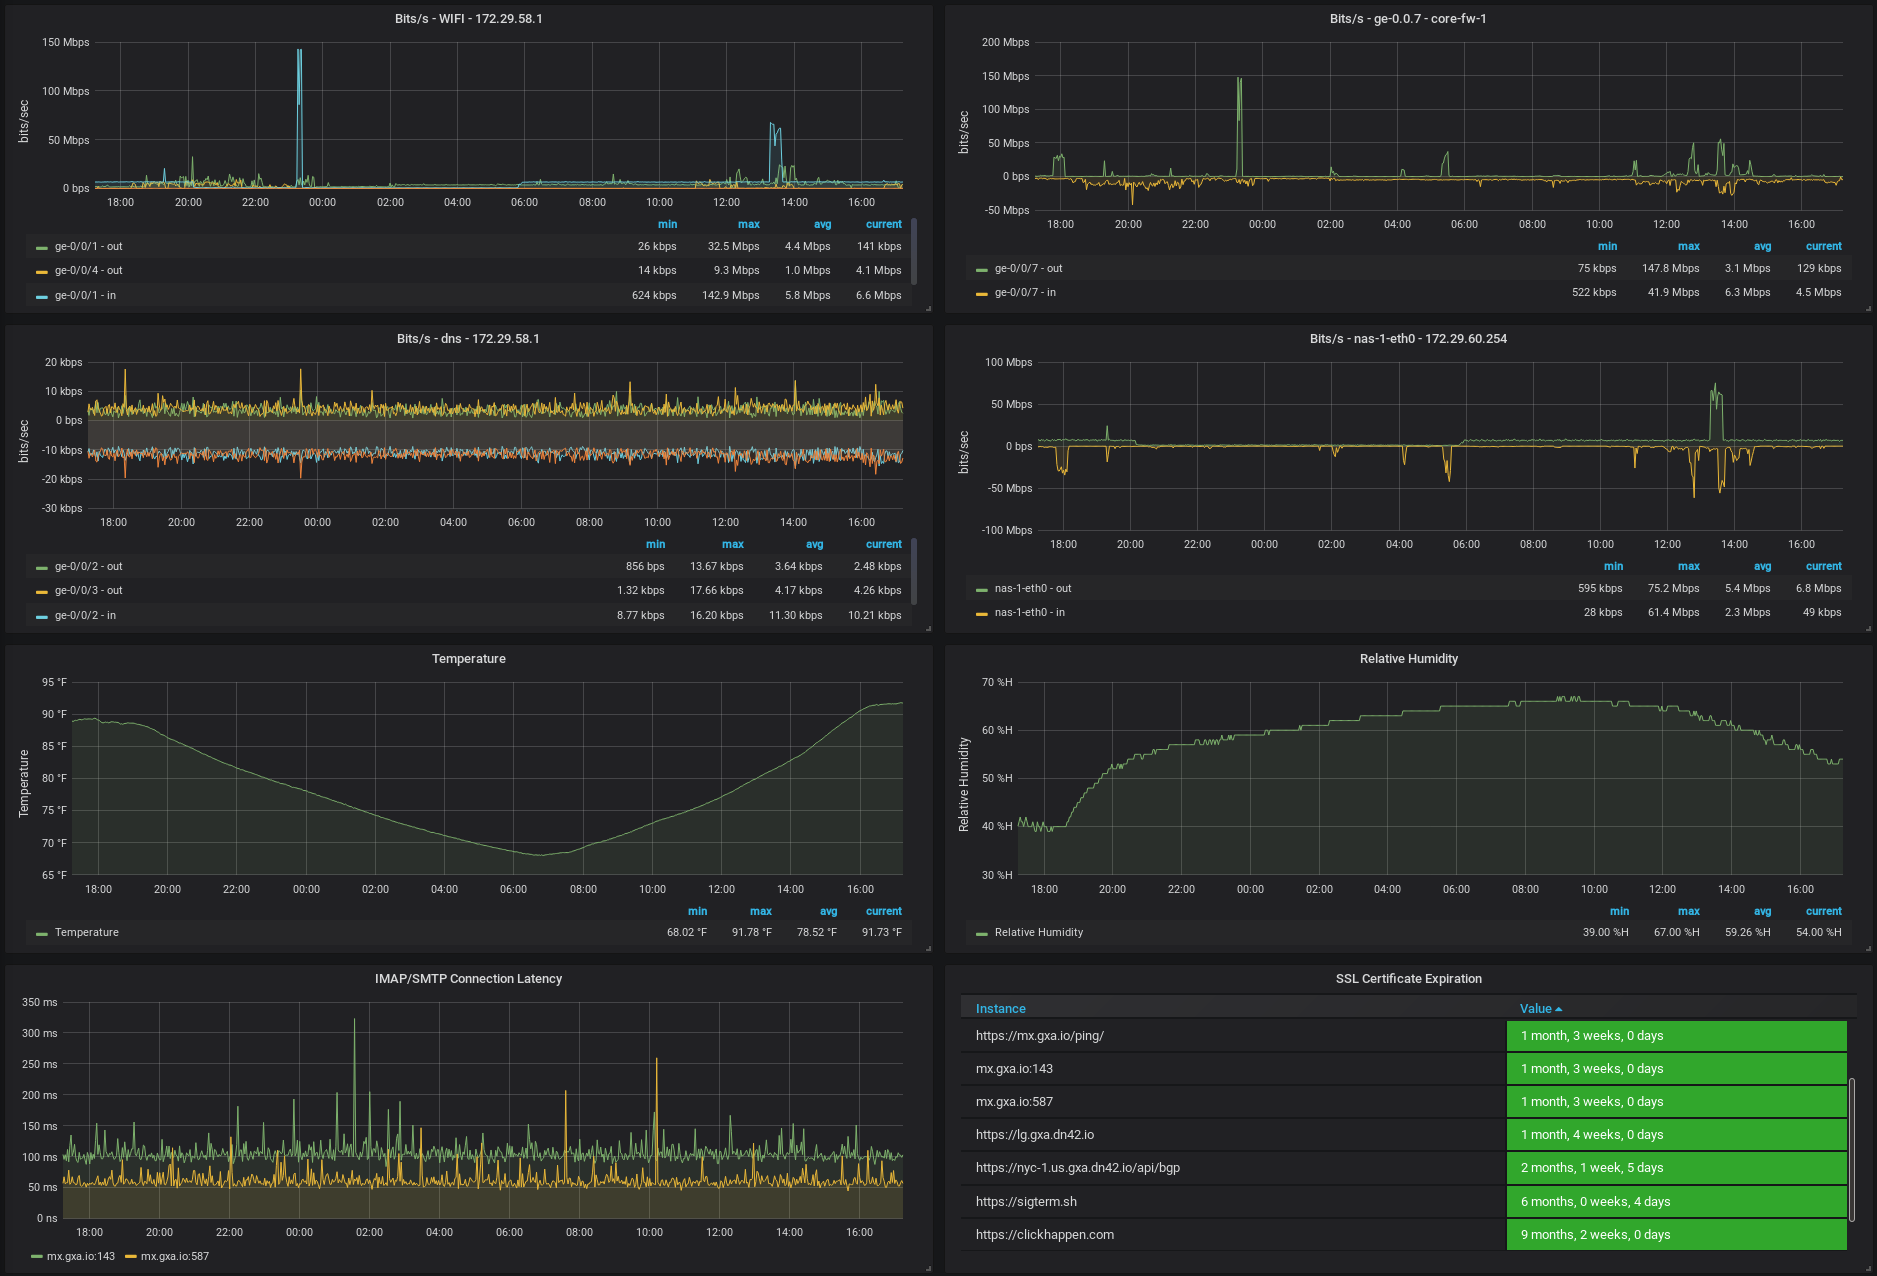
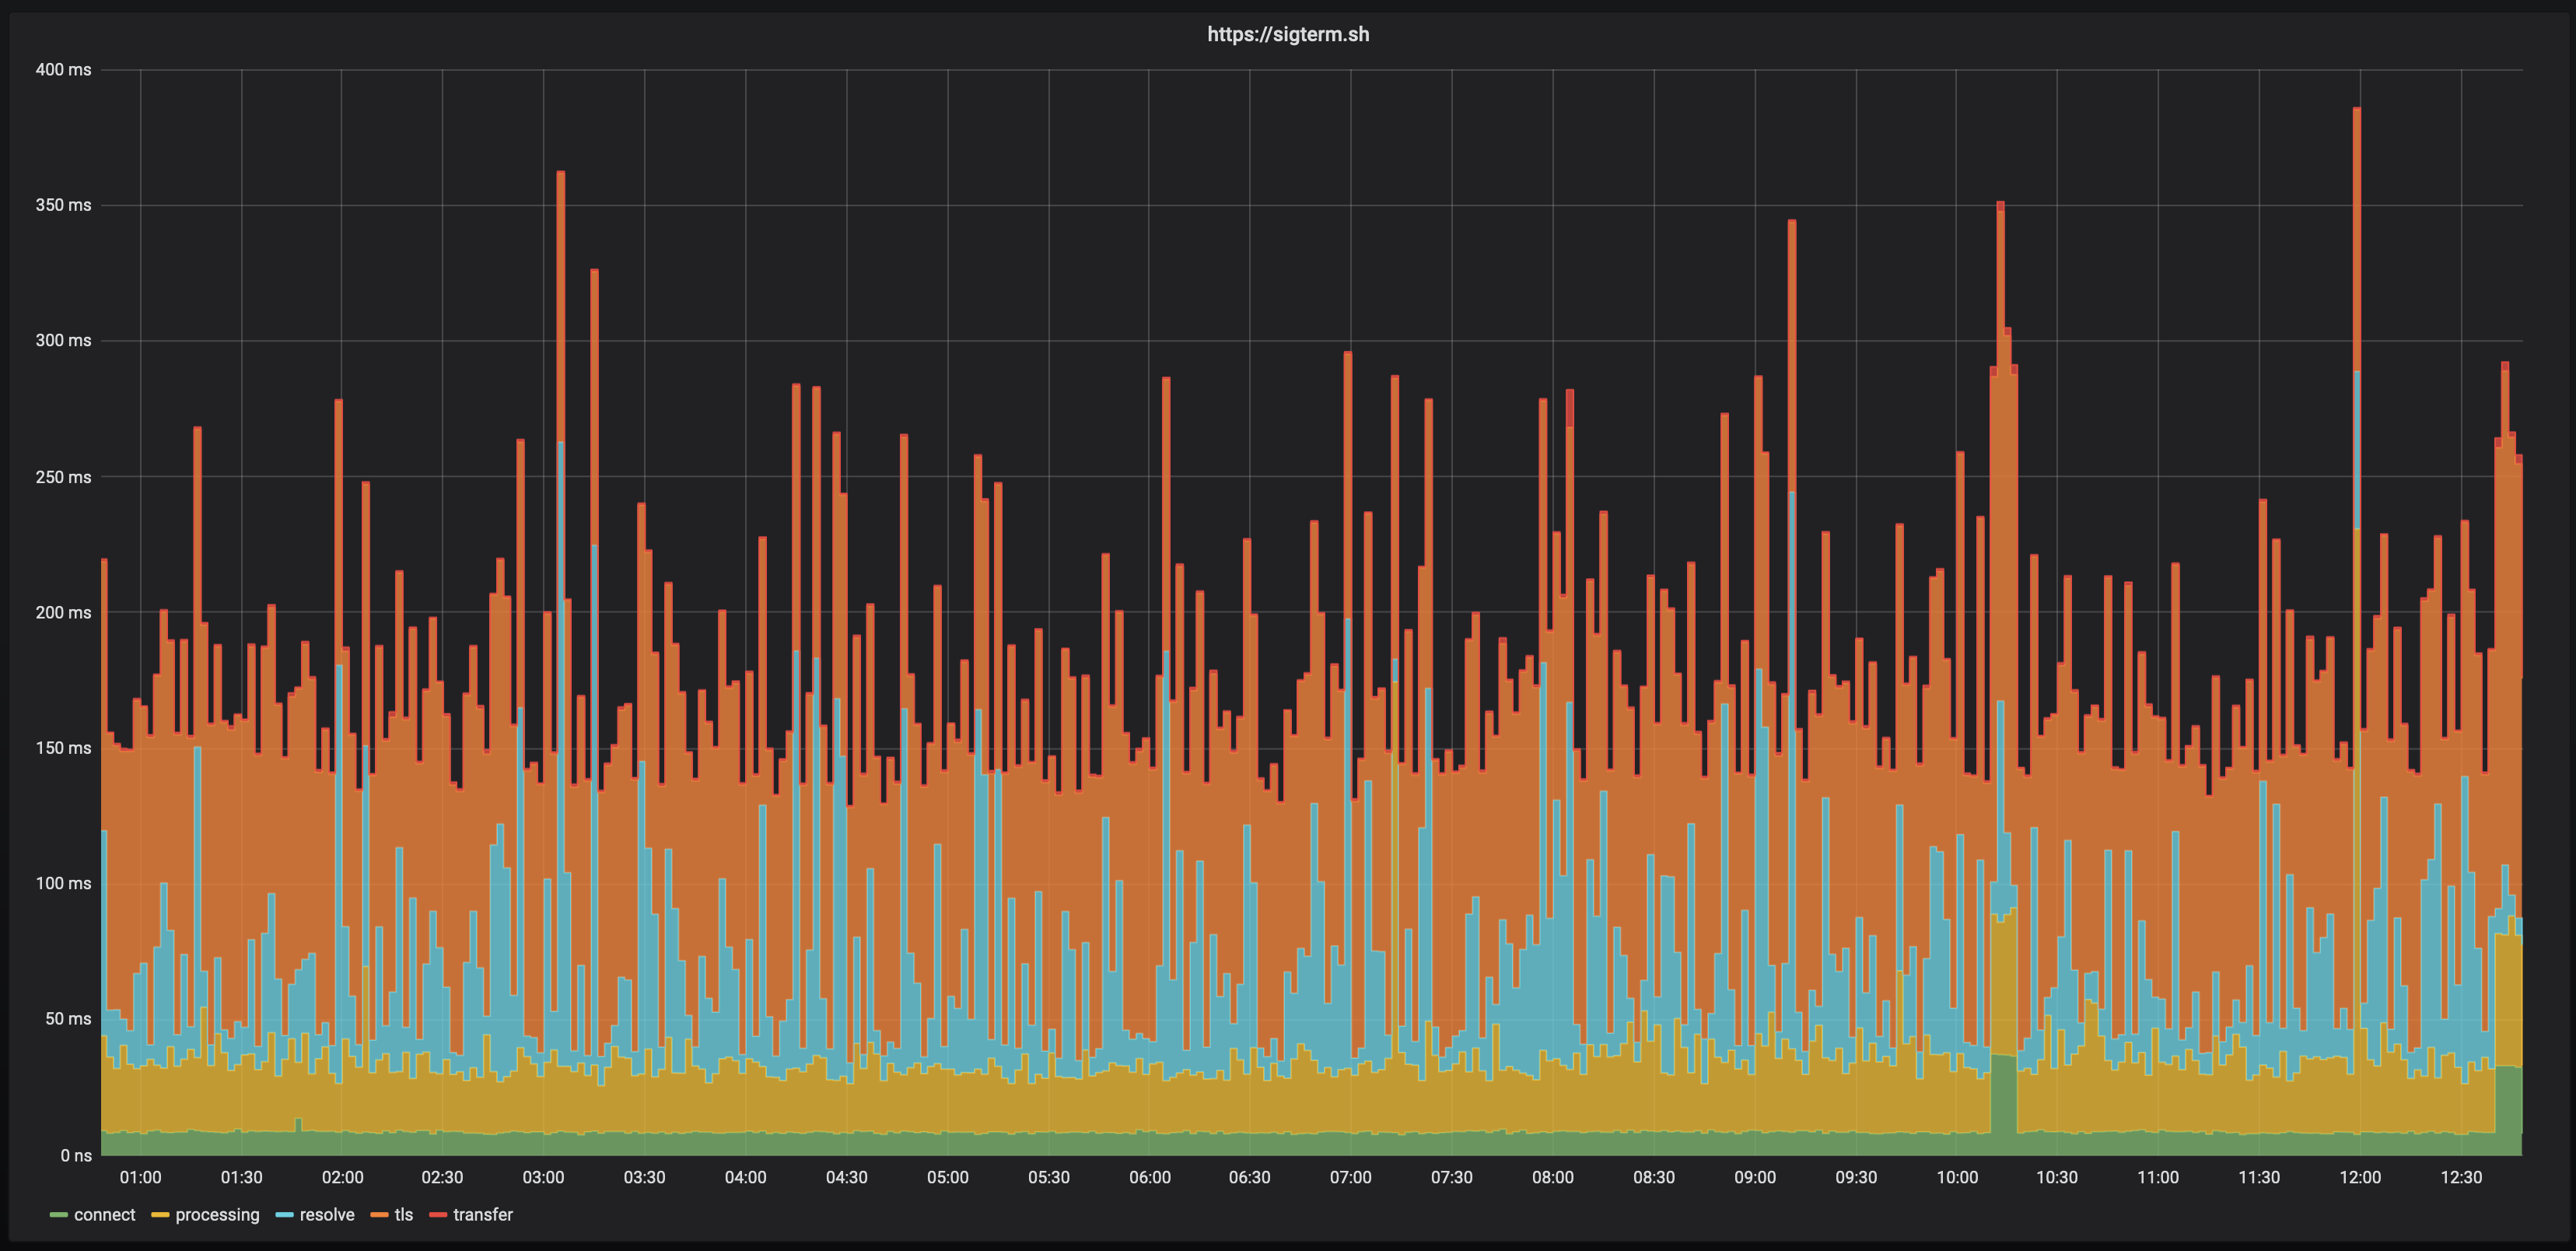
# ^ The SNMP exporter's real hostname:port.The Final Result
Here are a few graphs I threw together demonstrating some SNMP data from my core firewalls and switches, along with some temperature and relative humidity graphs from my pine64 project, a monitor for SMTP and IMAP connection latency and finally some SSL certificate expiration monitoring.